Routing Cables in a Nuclear Reactor
Abstract
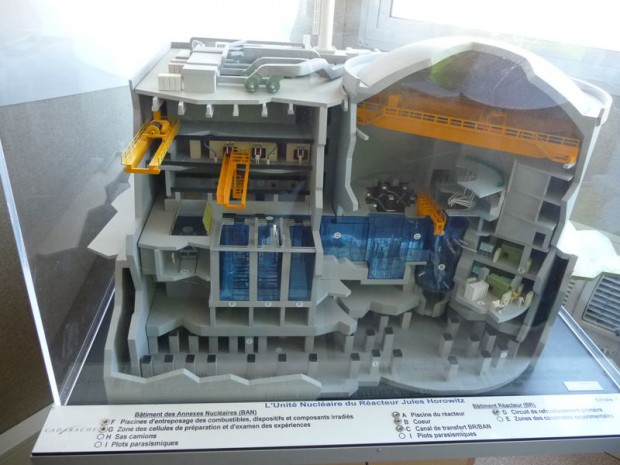
This article recounts a real-world project to optimize cable routing in the Jules Horowitz Reactor, a nuclear research facility. Faced with fragmented data, manual errors, and computational bottlenecks, traditional modeling approaches led to significant delays. By leveraging a graph database solution, our small team transformed the process, enabling on-demand route computations that reduced turnaround from weeks to minutes. We detail the key challenges and the strategies that ensured success.
Introduction
How does one begin computing routes for cables in a nuclear reactor? By responding to public market tenders in one's spare time. In 2023, I encountered an intriguing challenge: how to optimize the routing of cables within the Jules Horowitz Reactor.
Problem
Modeling teams were tasked with determining the paths for cables within the reactor. The result was a 3D model that generated outputs such as the following:
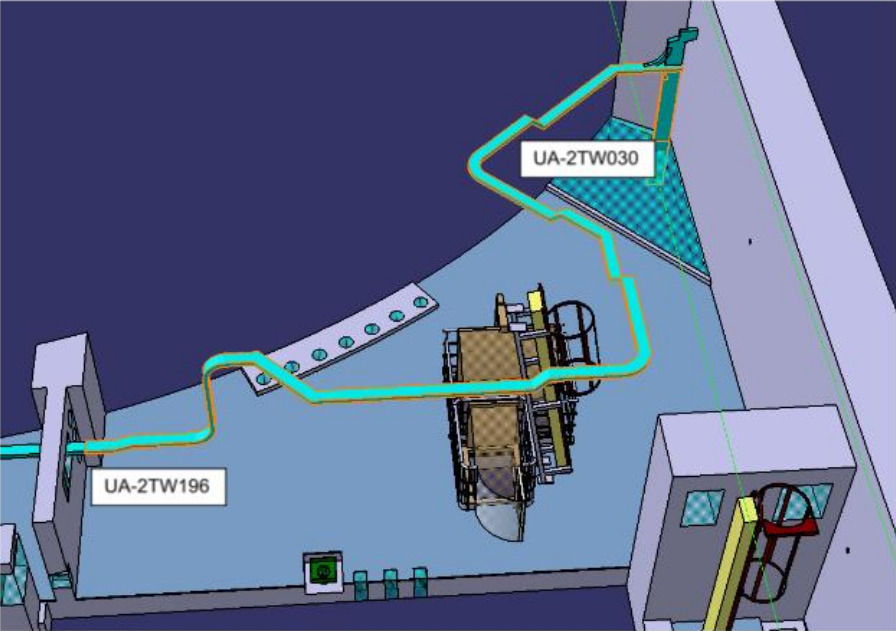
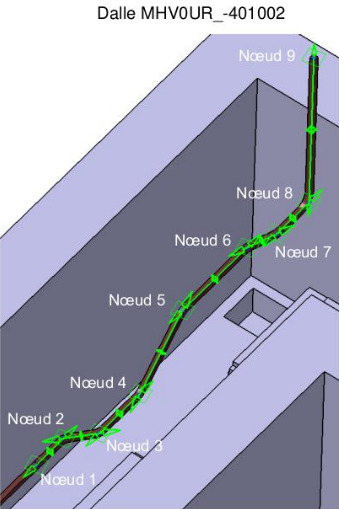
The cable tray, shown as the turquoise tube spanning from one wall to another, was represented as segments, each defined by a set of points (x, y, z, and other data):
These points were stored in Excel spreadsheets and Access databases. However, this approach faced several issues:
- Data was divided among multiple teams, each responsible for different reactor levels. Teams adopted varying implicit conventions to align junctions between models, complicating connections between neighboring levels.
- Data within each level was manually edited, leading to errors such as missing points or "holes" in the model, which prevented accurate path computation.
- Algorithms implemented in Excel, intended to identify possible paths and calculate properties like path length or cable tray volume capacity, were unable to handle the large number of points.
As a result, the project experienced significant delays.
Solution
I was told that we won the contract because we were the only ones to offer a solution based on a graph database, which seemed like a good fit for modeling an electrical network. Indeed, it worked as expected, and routes were finally computed on demand. Results that took weeks to compute were done in a few minutes. Here were the main challenges:
- Assembling a team of talented engineers. The team ended up consisting of a total of four people.
- Managing the turnover of the client team. We interacted with about 10 different "interfaces" during the course of the project. Each time, knowledge had to be transferred to compensate for the loss of experience.
- Reconstructing the original model. The input data — i.e. the Access databases and Excel sheets — contained thousands of rows and tens of columns. This data conformed to definitions that we had to reconstruct, as they were scattered across the people who had worked on the project on the client side.
- Cleaning the data. Once the original model was recovered, we had to develop methods to "clean" the data — i.e. to identify values that did not satisfy the definitions of the original model and find ways to complete the missing parts.
- Building a graph model. For our project to succeed, we had to map the original model to a graph model that made the various computations possible. Finding the right model was crucial in order to minimize the cost of the graph database used to support it.
- Building the graph. Building a program to map the original model to the graph model was not enough; we also had to develop heuristics to complete the data with reasonable synthetic data using automated strategies drawn from the on-site personnel. Indeed, many routes could not be computed otherwise, as the data had "holes".
- Performance. As it turned out, synthetic data is not easy to generate: it requires clever algorithms to be computed with the hardware at hand — i.e. a couple of laptops. We used GraphBLAS1 for the most compute-intensive tasks, delegating the rest to the graph database engine.
- Deployment. For easy deployment, we packaged all the components into various Docker images. Some constraints made it impossible to have a monolithic implementation, as it was required to have the graph database in its own container so that it would be queried only through the network for various reasons. One of them was to ensure that it could be swapped with another if needed to manage costs.
Results
- Computing routes in the electrical network used to take weeks; it now takes just a few minutes.
- A map of the electrical network has been constructed in the form of a graph, enabling its owner to address a variety of crucial questions essential for maintaining the nuclear reactor.
Conclusion
This project delivered timely cable routing solutions for the Jules Horowitz Reactor but also highlighted the transformative power of graph modelling in handling complex, interconnected systems.